Thursday, March 31, 2011

The shrinking labor force and falling labor participation rate

With March’s labor report out tomorrow, a behind the scenes look at the labor force that is measured by the government’s household survey provides us with a different look at what’s happening among job seekers that we don’t traditionally see from a quick glance at nonfarm payrolls and the unemployment rate.

First, a couple of definitions are in order.  Nonfarm payrolls are calculated by the government and are released the first Friday of each month in what is called the Establishment Survey.

The unemployment rate accompanies the nonfarm payroll data but comes from a separate survey called the Household Survey.

As its name suggests, the establishment survey tallies workers and is taken from businesses and local and state governments.  The household survey, however, is a detailed questionnaire aimed at households and tells us who is working, not working and looking for employment, and not working and not looking for a job.

image

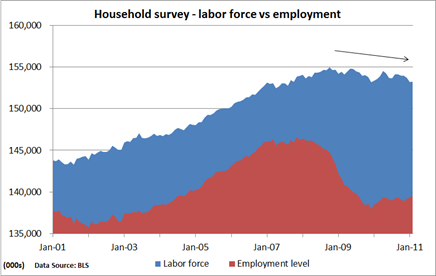
The chart above reveals what has happened over the last decade to the labor force – those who are working full time or part time and those who are actively searching for work but are not working – and employment – those working full or part time.

Note: Those who are retired, under 16, in prison or a nursing home, active duty, in school, or are home  because of family responsibilities are not counted in the above graph and are not in what the government calls the labor force.

The difference between the two lines gives us the number of unemployed.

As an example, the level of employment in February 2011 stood at 139,573, while the number of individuals in the labor force stood at 153,246.

The difference, 13,673, measured those who were unemployed. Divide that into 153,246 and you get the unemployment rate of 8.9%.

Simple enough? Absolutely!

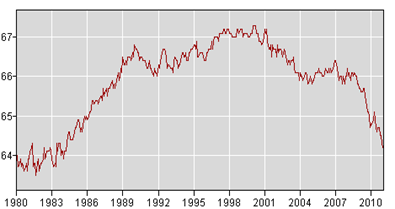
What is not so simple to explain and what has puzzled economists is the steep decline in the labor participation rate, or the portion of the non-institutionalized population 16 or older that is part of the civilian labor force.

Labor Participation Rate
image
              (Source: BLS)

The worst recession in 70 years has clearly blunted the growth in the labor force, as some have been forced into early retirement, while others have stayed in school amid poor job prospects and still others have returned to school.

And still others, unable to find work after months of fruitless efforts, have temporarily given up the job search.  All of these factors have probably played a large role in muting the rise in the unemployment rate as well as reducing the unemployment rate to a still-high level of just under 9%.

Had the labor force continued its uninterrupted trend over the past decade, the jobless rate would now stand near 12%!

An improving economy should draw some of the discouraged workers back into the workforce, and those who have returned to school or stayed in school will eventually be drawn back into the labor force.

That should put the labor force on an upward track. Further, general population growth should also lend support.

However, recent forecasts by economists of faster labor force growth from discouraged workers returning to the job search have failed to materialize, and a lack of upward movement could present longer-term problems for the U.S. economy.

Tuesday, March 29, 2011

Concerns about prices, income pressure consumer confidence

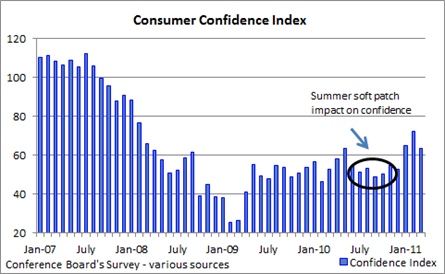
The Conference Board reported today that the Consumer Confidence Index fell from an upwardly revised 72.0 in February to 63.4 in March, roughly in line with most analysts forecasts.

Lynn Franco, Director of The Conference Board Consumer Research Center said, “The sharp decline in confidence was prompted by a sharp decline in expectations. Consumers’ inflation expectations rose significantly in March and their income expectations soured, a combination that will likely impact spending decisions.

image

“On the other hand, consumers’ assessment of current conditions improved, indicating that while the short-term future may be uncertain, the economy continues to expand,” he added.

Fears that a decline in consumer confidence might eventually impact consumer spending, which makes up about 70% of GDP, would normally be warranted; however, investors at this point appear to be brushing aside the turmoil in the Middle East that has sent oil prices sharply higher, and the earthquake in Japan that is beginning to affect the supply chain.

Moreover, a one-month drop in confidence must be looked at in the context of the overall trend.

In other words, the subsequent rally in stocks that followed the brief sell-off a couple of weeks back suggests that investors are betting the economic recovery is intact, which is signaling further gains in employment and another round of upbeat earnings.

Monday, March 28, 2011

Pending home sales gradually moving higher

The National Association of Realtors reported this morning that the Pending Home Sales Index, a forward-looking indicator that looks at contracts signed and not closings, increased 2.1% in February to 90.8.

image

NAR Chief Economist Lawrence Yun tried to put the best face possible on the otherwise lackluster report, noting, “Month-to-month movements can be instructive, but in this uneven recovery it’s important to look at the longer term performance.”

“Pending home sales have trended up very nicely since bottoming out last June, even with periodic monthly declines. Contract activity is now 20 percent above the low point immediately following expiration of the home buyer tax credit, he said.”

True but June’s rock-bottom low followed a burst of activity that was tied to the government’s tax credit, which helped mostly to move sales from the summer months into the spring and send the market on a roller coaster.

Sales have rebounded from the low but are not much higher than the activity we saw in early 2008 amid continued concerns about the direction of home prices and general fears among potential buyers that the market may not have bottomed.

Mortgage rates are still very favorable, which has housing affordability at or near an all-time high.  But until we see a jump in consumer confidence and a general feeling that the economy is creating employment, housing may continue to struggle.

Inflation genie not out of the bottle, yet

But prices are beginning to drift higher

Federal Reserve Bank of Philadelphia President Charles Plosser warned Friday of the risks of keeping monetary policy too easy in the face of an energy price shock,  the Wall Street Journal reported.

“What creates inflation is monetary policy at the end of the day,” Plosser said.

Citing the jump in energy prices, Plosser said, “The reason oil prices worry me is that there will be more pressure to keep monetary policy easier for longer,” as some fear such price hikes will cut into discretionary spending and dull the recovery.

“That response is a response that will in my view” create inflation, and “we need to lean against that,” he added.

Conversely, Atlanta Fed President Dennis Lockhart was less concerned about the latest burst in headline inflation, saying on the same day, “While short-term measures of inflation have moved up rather strongly in the last few months, I hold to the view that this trajectory will not persist.”

He noted, “Inflation pressures associated with rising commodity prices will dissipate if, as currently expected, the rate of growth in these prices slows.”

Unlike the official Fed focus on core inflation – inflation minus food and energy – Lockhart added that the Fed should be looking at headline inflation, which includes changes in food and energy.

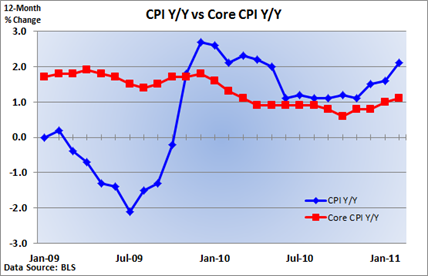
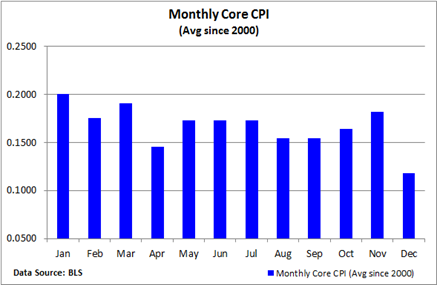
Headline inflation has jumped over the past three months in response to higher food and gasoline prices, with the year-over-year headline inflation nearly doubling in three months to 2.1%.

Core inflation, however, has remained fairly stable, though prices have edged up a faster-than-expected 0.2% in both January and February, the first such increases in over a year.

Still, it’s worth noting that core prices tend to rise faster early in the year, suggesting the BLS’ method for adjusting for seasonality may not be capturing all the nuances of price changes.
image

Nonetheless, even if we’re beginning to see the first pick up in core inflation (and I believe we are), it’s not something to be worried about, at least not yet.

(Addendum: The Fed-favored core PCE Index released today rose 0.2% in February, the second such increase in a row following virtually no change over the prior five months, providing the latest evidence that prices are slowly creeping higher.)

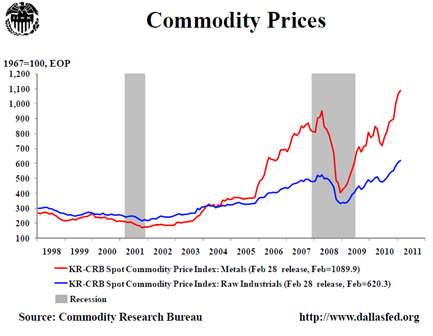
But the surge in commodity prices since the end of the summer has been squeezing manufacturers and may eventually threaten price stability, especially as the Fed continues to hold rates at near zero and buy hundreds of billions of dollars in bonds.

Indexes that measure metal and raw material prices have marched to new highs, while broader measures of raw material prices remain below the 2008 peak thanks in large part to crude, which remains well below its 2008 high.
image

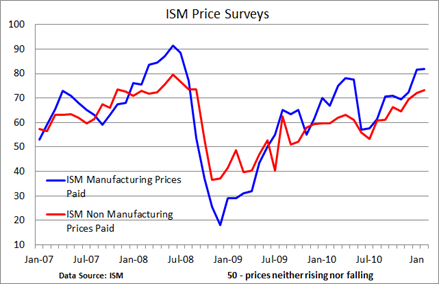
Manufacturers are feeling the sting from increased prices at the early stages of production (see chart below), as evidenced by the national ISM surveys for both manufacturing and non-manufacturing industries.
image

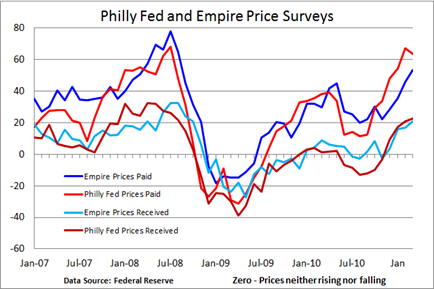
The ISM surveys do not look at prices manufacturers receive for their goods, only the cost of raw materials. However, regional surveys by the Fed do take that into account.

For much of the shallow recovery, manufacturers have had little ability to pass along higher commodity costs, and either had to squeeze out additional efficiencies or take a modest hit to margins.
image

But as the chart above reveals (see prices received), that is beginning to change.

And according to the Fed’s latest Beige Book – a summary of economic conditions in each of the Fed’s twelve districts – manufacturers said “...they were passing through higher input costs to customers or planned to do so in the near future.”

It seems unlikely the Fed might act on anecdotal evidence alone (and that’s what the Beige Book is about), but the remarks have merit in my view since they are apparently being corroborated by the Fed’s regional surveys.

QE2 – higher stock prices and higher commodity prices
Inflation expectations were cratering last summer amid the slowdown in economic activity associated with the sovereign debt crisis in southern Europe that caused a modest amount of instability in the credit markets. And the resulting slowdown in U.S. economic activity gave many a temporary respite from higher raw material prices.

Fed fears of deflation, increased odds the economy might enter a double-dip recession (both unwarranted in my opinion) and a stagnant labor market led the Fed to discuss and eventually embark on a plan to buy $600 billion in longer-term Treasury bonds.

Its goal: stimulate demand, revive the sagging labor market and modestly bolster inflation expectations.

Economic activity has accelerated since the fall and stock prices have surged well above summer lows.  Of course, the Fed is comfortable with the assertion that it helped to engineer the rise in stock prices.

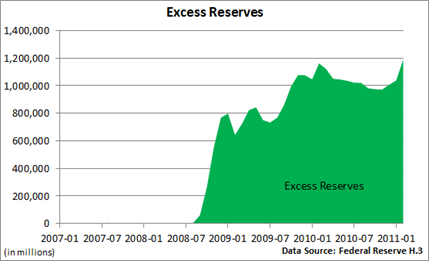
But it doesn’t believe the extra cash it has pumped into the economy has found its way into raw material prices.
image

Most of the newly injected liquidity has ended up back at the Fed, as banks have taken the extra deposits from the central bank’s bond buys and held them in reserve, doing little for the economy – think liquidity trap.

Still, the Fed's talk last fall about loosening the monetary reins and the eventual implementation of a second round of quantitative easing does appear to be encouraging speculation in commodities; if not with QE2 dollars, then individual investors as well as hedge funds and institutional investors.

I don’t believe we are on the cusp of sharply higher inflation, as there is still plenty of slack in the economy, and wage pressures remain muted mostly due to the modest labor market uncertainty that still plagues many who are employed and the huge pool of labor that’s available.

Also, longer-term inflation expectations – a key driver of future inflation – remain under control. Besides, we wouldn’t have a ten-year Treasury sitting at a yield of just below 3.50% if investors were openly fretting about inflation.

Nonetheless, the economy is now running under its own power and monetary policy remains extremely accommodative, which means the Fed is beginning to run the risk that it may spark a bout of unwanted inflation down the road.

Hence, it must begin to consider and implement and exit strategy sooner rather than later.

I doubt the Fed will end its QE2 plan early, but very small and measured hikes in the fed funds rate would send a strong signal to the financial markets that all the Fed’s chatter about its willingness to battle inflation isn’t just talk.

A fed funds rate of 50  bp, or 75 bp or even 1%, raised in stages, would still be extremely accommodative by historical standards.
Thursday, March 24, 2011

Weekly jobless claims settling below 400,000

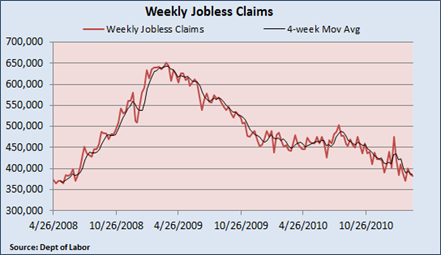
Weekly initial jobless claims posted a small 5,000 dip in the latest week to 382,000, while the 4-week moving average slipped by 1,500 to 385,250.

image

That’s the fourth week in five weekly claims have held below 400,000, signaling that the burst in economic activity that began late last year and early this year is continuing into March.

The gradual improvement in jobless claims also suggests that the labor market continues to slowly heal.

Historically speaking, claims are still a bit on the high side, reflecting how far the economy sank during the recession and the modest uncertainty that still exists as the recovery officially enters its 21st month.

But the downward trend is intact, as employers sense the pick up in the economy and the need to retain workers.

Wednesday, March 23, 2011

Housing–losing its importance as an economic driver

Quite frequently, I’ve heard many wonder how the U.S. economy could enter a more robust phase if housing continues to languish?

Isn’t housing one of the pillars that support economic activity?  And besides, isn’t housing usually a leading indicator that pulls the economy out of a recession?

It typically is, and I must confess that I have also postulated that it would be difficult for the U.S. recovery to enter a more robust and permanent phase without any participation from housing.  But that is apparently what is happening.

image

Let’s look at the chart above, which provides us with a clear look at residential investment and its contribution to GDP going all the way back to the first quarter of 1947, when the government first released quarterly GDP data.

The bull market in residential spending/construction that began in the early 1990s at just over 3% peaked in 4Q2005 at 6.26%, helping to fuel overall output in the U.S.

But what we saw in housing during much of the last decade was what I like to call a “false prosperity” because it was fueled by easy money, speculation and overbuilding and not by true aggregate demand.

And the housing industry (and the rest of us) has been paying the price ever since in falling home values and a near implosion of the financial sector that nearly wrecked the U.S. and global economy.

But now that housing accounts for just 2.25% of GDP - a sharp four percentage points below the recent peak! – it doesn’t have near the ability to dent total output like it once could a few short years ago.

That’s not to say that further weakness in new home construction caused by a shadow inventory that competes with builders might not modestly detract from growth, but housing’s influence on GDP has waned and other sectors have begun to fill the void.

On the flip side, we are now well below the 60+ year average of 4.70% so it seems more likely that falling unemployment and a loosening of tight credit standards might just eventually set a new cycle in motion and allow housing to underpin activity.

Tuesday, March 22, 2011

Fed’s Fisher worried about U.S. debt

The Federal Reserve has become much more transparent in recent years, telegraphing changes in policy ahead of time so as not to surprise financial markets.

Many times, we’ve detected an upcoming policy shift from a speech by one of the many regional Fed presidents.

Dallas Fed President Richard Fisher may not be the one who throw the market a bone or two when it comes to a change in monetary policy, but he shoots straight from the hip and doesn’t mix words.  And his latest remarks before an audience in Germany did not disappoint.

Considered to be one of the most hawkish members of the Fed, Fisher pointed out, "If we continue down on the path on which the fiscal authorities put us, we will become insolvent. The question is when."

Ben Bernanke has more or less said the same thing, but has been much more diplomatic and sensitive in his approach so as not to rock financial markets.

With total federal debt approaching 100% of GDP, Fisher’s blunt talk should not be ignored.  The Republicans in the House of Representatives have debated cuts of over $60 billion, but unless meaningful entitlement reforms are passed (and thus far most politicians have quietly tiptoed around such talk), any significant debt reduction will remain out of reach.

In the meantime, Fisher is unlikely to support any additional moves by the Fed to stimulate the economy.

He said the economy is growing by itself and added, “The Fed has done enough, if not too much, and we should do no more. In my opinion no further accommodation is necessary after June.”

It’s not yet clear how the massive earthquake that hit Japan will affect the U.S. recovery, and turmoil in the Middle East continues to prop up the price of crude.

However, outside of oil, energy prices are stable and judging from the recent rebound in stock prices, the financial markets appear to be taking the upward move in crude and the tragedy that is affecting the world’s third-largest economy in stride.

Monday, March 21, 2011

Lousy month for existing home sales

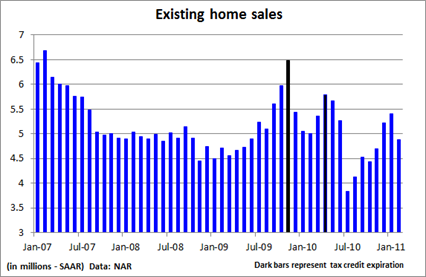
Existing home sales tumbled 9.6% to a seasonally adjusted annual rate of 4.88 million in February from an upwardly revised 5.40 million in January.

image

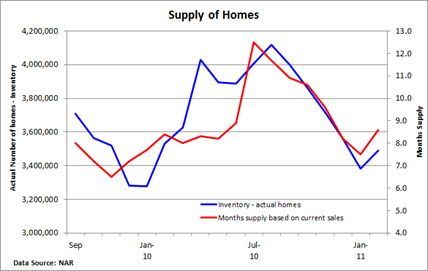
And February’s poor showing lifted total housing inventory by 3.5% to 3.49 million existing homes available for sale, which represents an 8.6-month supply at the current sales pace, up from a 7.5-month supply in January.

image

The NAR’s chief economist Lawrence Yun pointed out that sales are being constrained by the twin problems of unnecessarily tight credit, and a measurable level of contract cancellations from some appraisals not supporting prices negotiated between buyers and sellers.

Yun added, “This tug and pull is causing a gradual but uneven recovery.”

Rough weather in January and February may have also played a minor role, delaying showings and pushing sales into March, but we’ll need to look at the data next month in order to verify if this is the case.

Nonetheless, the very high level of affordability and the improving economy have yet to spark much of an interest in the housing market.

Further, we are seeing an expanding and a quickening in the economic recovery without any fuel being provided by the housing market – an unusual occurrence since housing typically leads.

Likely reason: as sales of new and existing homes have subsided over the last five years, housing has played a much smaller role in the overall economy, and weakness in the industry is not having near the impact it once had.

But a firm recovery in housing would provide an overall boost to GDP, and absent a big improvement in job creation, housing seems likely to muddle along in a slow and uneven recovery for much of the year.

Saturday, March 19, 2011

Volatility in stocks and a look at jobless claims, CPI

Last week’s market volatility provided plenty of action for investors, and in most cases, the roller-coaster ride was a bit much for most of us.

Worries about the nuclear disaster in Japan and the surrounding uncertainty sent stocks sharply lower at the beginning of the week, but shares managed to limit losses by Friday.

With the economic data taking a backseat to global events, I wanted to take a moment and look at a couple of important releases during the week.

First, weekly jobless claims tumbled 16,000 to 385,000. With seasonal factors out of the way, the reassuring decline indicates that the labor market continues to slowly heal as the pick up in economic activity hinders layoffs. So far, the jump in gasoline prices is not doing much to slow the recovery.

image

Second, a quick overview of retail inflation.

Not surprisingly, the Consumer Price Index jumped 0.5% in February amid a 3.4% rise in energy costs and a 0.6% rise in food.   Energy has jumped by more than 1% in six of the last seven months, and the latest surge in gasoline prices last month continues to push energy higher.

Food is a different matter.  Agricultural costs began their upward climb last year, but the CPI didn’t detect rising retail prices until January.  Given the steep rise in energy and the increase in food prices, the jump in the year-over-year headline rate is to be expected.

image

However, the Fed tends to throw out food and energy costs when it looks at price stability, and core inflation, though ticking higher, remains well-behaved on a year-over-year basis.

Nonetheless, a note of caution is warranted.  The core rate has risen 0.2% in both January and February.  Not a big deal except prior to January, we had to go back to October 2009 before we saw prices rise at that rate.

That’s still modest but the CPI is beginning to detect a slow acceleration in inflation, as the recovery picks up steam and steep increases in raw material prices are slowly passed on to consumers.

As I mentioned last month, the best news on inflation is behind us. But I’d be careful about betting on any tightening in Fed policy at this juncture, especially given the uncertainty that has crept into the economic outlook in recent weeks.

Friday, March 11, 2011

Middle East uncertainty, higher gasoline prices dampen consumer sentiment

The big jump in gasoline prices brought on by the escalating violence in the Middle East took a big toll on consumer attitudes during the early part of March according to the latest survey on consumer confidence.

The Reuter's/University of Michigan's Consumer Sentiment Index fell from 77.5 in February to 68.2 in March, according to preliminary data.

image

The survey's peek at current economic conditions came in at 83.6, down from 86.9 the month before. The survey's gauge of consumer expectations tumbled to 58.3 from 71.6, the lowest level since March 2009, Reuters said.

The upward spike in gasoline prices not only dampened sentiment more than expected, it also boosted inflation expectations.

The one-year outlook increased by 1.2 percentage points to 4.6%, while longer-term inflation expectations, which have generally been stable, increased 0.3% to 3.2%.

Still, longer-term bond prices have been fairly stable amid the spike in gasoline, suggesting that consumers may be overreacting to what’s happening to oil prices.

I’m already hearing chatter among some analysts that falling consumer sentiment will hurt consumer spending, but I remain unconvinced that the rise in gasoline prices will derail the recovery, especially given that natural gas and other forms of energy have been largely unaffected by what’s going on overseas.

Unless gasoline prices continue to surge, the impact on consumer spending will likely have only a limited impact at the nation’s retailers.

Economic recovery keeps retailers busy

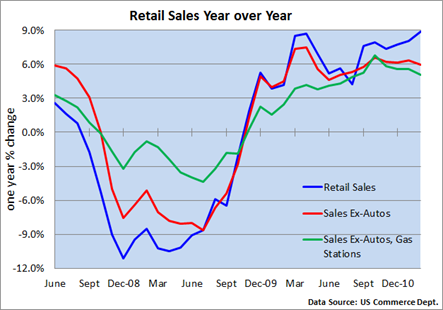
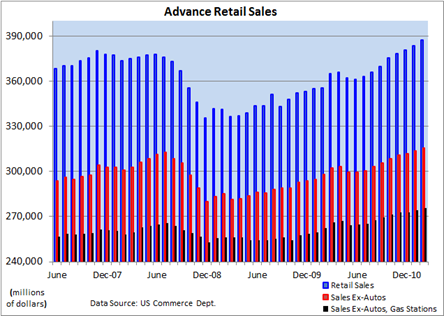
Retailers benefited from the improving economic recovery last month, as the government reported this morning that retail sales increased by 1.0%. Ex-autos, sales were up 0.7%, and removing autos and the impact of higher gasoline station sales, so-called core sales grew a respectable 0.6%.

Retail sales have risen for eight consecutive months amid the improvement in the economy and rising consumer confidence. And the effort by the government late last year to put extra cash in our pockets also seems to have played a role.

image

Despite the improvement in the economy, modest job creation and the decline in layoffs, growth in core sales, as the chart above reflects, has been gradually slowing down after peaking in October.

It’s not something to be concerned about in my view, but it is something that’s worth watching, as we continue to gauge the strength of the consumer and the expansion.

image

Thursday, March 10, 2011

Stocks punished as Dow slips below 12,000

Stocks came under heavy pressure today amid a host of concerns that sent the bulls running for cover.

The Dow Jones Industrials slid 228 points to 11,985, the S&P 500 Index lost 25 points to end the day at 1,295 and the Nasdaq shed 51 points to finish at 2,701.

A larger-than-expected jump in weekly jobless claims started the day out on a sour noted, calling into question some of the recent signs showing that the labor market is beginning to heal.

Investors were also spooked by a downgrade of Spain’s sovereign debt by Moody’s, which cuts its rating one notch from Aa1 to Aa2.

Data out of China that signaled the growth in the global economy may be slowing also played a role in today’s decline.

Meanwhile, worries about the U.S. and the global economy helped to knock off over $2 dollars per barrel off the price of oil, which given what’s been happening in recent weeks, might have invited investors back into shares.

But economic concerns overshadowed any benefit that the decline in crude might have had.

Taking profits

In my view, it’s important to take a step or two back and look at what’s really gnawing at investors.

First of all economic activity has been accelerating, which is underpinning the profit picture and has been helping to fuel big gains in stocks over the past several months.

Of course, we need not discount the Fed’s implementation of another round of QE.

But the latest leg of the bull market that began in July has taken shares up over 30%, as measured by the S&P 500 Index, and turbulence is to be expected.

More specifically, looking at the catalysts to today’s decline tells me that investors needed a good excuse to bail out of stocks, and one reason was as good as another.

A 26,000 rise in weekly jobless claims to 397,000 should be taken with a grain of salt since the weekly data can be quite volatile.  Difficulties in adjusting for seasonal factors likely led to last week’s larger-than-expected decline so we are seeing some payback this week.

Still, claims have been below 400,000 in four of the past five week, which is an excellent indication that not only is the labor market is on the mend but growth is accelerating.

We’ve seen economic data before from China that suggested the global recovery was slowing down without a material impact on corporate earnings.

And Moody’s downgrade of Spain puts it in line with how S&P views the debt, per Marketwatch, so we aren’t really seeing anything new. The 3-month LIBOR rate held steady, though the TED spread did inch up to the high end of the range it’s been in since last August.

Going forward, an upward drift in either rate could be a sign of growing stress in the financial system, but at this point we’re seeing only cosmetic cracks.

Summing things up, the market has been due for a correction, and unease in the Middle East and sovereign debt worries were just what was needed to send the bulls scurrying out of the market today.

Disclaimer: The commentary provided is for informational purposes only and should not be used to time the market. Before making an investment decision, please consult your financial advisor.

Wednesday, March 9, 2011

Oil and the alternative energy myth

Alternative energy has been touted as a way to wean the U.S. from its seemingly insatiable appetite for oil and reduce our dependence on unstable sources.  On the surface it sounds like a great idea, but digging beyond the rhetoric reveals something vastly different.

The jump in crude oil prices during the prior decade interrupted the relatively sanguine energy landscape we experienced during much of the 1980s and 1990s, sparking a renewed interest in everything from energy efficiency in automobiles, homes and appliances to boosting production of alternative forms of energy, such as wind, solar, biofuels, etc.

The steep drop in gasoline prices and falling utility bills during the recession seemed to lessen the need for a comprehensive energy policy, as the focus in Washington shifted to other concerns.

image 
But as the BP crisis in the Gulf of Mexico took center stage last summer, advocates of alternative energy were quick to point out the dangers of offshore drilling and the nation’s dependence on oil, and didn’t miss a beat as they asked for a renewed focus on wind and solar energy.

Further, the dramatic rise in violence in the Middle East and the spike in gasoline prices in recent weeks has highlighted how susceptible we are to an oil shock.

Therefore, the latest crisis is likely to bring forth renewed calls to quickly exploit alternative energy technologies.

But before we get to oil and alternative energy, a quick breakdown of U.S. energy sources is in order.

The chart above highlights U.S. energy consumption in 2009.  The vast majority of coal and natural gas originated domestically, but oil is a different matter, as the U.S. imported about 51% of its petroleum (crude oil and refined petroleum products) in 2009, according to data supplied by the Energy Information Administration(EIA).

It’s this 51% the country must aim to reduce.

Increased domestic exploration and production of crude will help but won’t eliminate the need for imports. The same holds true for natural gas and conservation.  Enter solar and wind.

But the question we must ask (and one that’s rarely heard):
“How will a greater reliance on alternatives, specifically solar and wind, actually reduce the country’s dependence on unstable Middle Eastern crude?”

First, let’s look at the latest data available provided by the EIA, which offers us a breakdown of U.S. imports:

 Country                     2010 U.S. imports (000s barrels per day)
Canada 2,532
Mexico 1,280
Saudi Arabia 1,094
Nigeria 1,025
Venezuela 987
Russia 611
Algeria 507
Iraq 414
Angola 390
Columbia 365
Brazil 271
United Kingdom 256
Virgin Islands 255
Ecuador 197
Kuwait 197
Total                                  10.3 million barrels per day
As the chart above shows, the U.S. receives over one-third of its oil from Canada and Mexico. Oil from the Middle East, with the exception of Saudi Arabia and Algeria, is not an important part of the portfolio.
Still, several of the countries on the list are not necessarily rock-solid sources of crude.

Consequently, reducing U.S. dependence on imported oil – a laudable goal – would enhance both the economic and national security of the U.S.
Back to the original question
How can alternatives play a significant role in reducing oil imports?

The chart below highlights the breakdown in U.S. electricity production, with coal, natural gas, nuclear and renewables (including wood, hydroelectric, biofuels, geothermal, solar, wind – see first chart) all playing a part.

However, oil accounts for just 1% of electricity generation.
image
(Source: U.S. energy Information Administration, December 16, 2010)

Let me repeat that and let it sink in. Oil accounts for just 1% of all the electricity generated in the U.S.!

Simply put a vast increase in wind and solar power would do virtually nothing to reduce our dependence on foreign oil. And calls in some corners that boosting wind and solar power would do just that do not line up with the facts.

It would, however, replace stable, domestic sources of energy such as coal and natural gas.

It can be argued that there are environmental reasons why we may want to reduce our reliance on fossil fuels, and exploring ways to cut the cost of wind and solar power so that it might become more competitive with coal and natural gas has merits.
Still, others may point to highways that might one day support a plethora of electric cars powered by wind and solar power.
According to the latest issue of a leading consumer magazine, the Chevy Volt ran nearly $50,000, which includes a $5,000 dealer markup (not included is a $7,500 tax credit).
But expect a range of just 35 miles according to the EPA, and tests by the leading consumer magazine during the winter came up even short of 35 miles, running between 23 to 28 miles. Apparently, cold weather zaps the length of the battery’s charge.
The current cost of electric vehicles are just too high and the batteries are not yet capable of anything near what’s needed to bring about mass acceptance.
Consequently, as the data show, significant increases in wind and solar power will do little to break our dependence on foreign sources of crude.

Tuesday, March 8, 2011

Oil spike unwarranted according to government official

Here's a piece I saw on Marketwatch.com: 

The spike in oil prices doesn't reflect fundamentals in the market, according to the top economics official at the State Department. "I think the increase in prices is considerably greater than the decline in supply would ordinarily suggest," said Robert Hormats, under secretary of state for economic, business and agricultural affairs, at the National Association for Business Economics annual policy conference.

In some sense he is correct, but like it or not a risk premium has definitely been built into the price of oil amid worries that an escalation in violence could spread to other oil producers and further squeeze supply.

Monday, March 7, 2011

Fed's Lockhart opens the door to QE3

Atlanta Fed President Dennis Lockhart opened the door to the possibility the Federal Reserve may authorize a new round of bond purchases amid worries that the spike in oil and gasoline prices could damage the expanding economy.

Lockhart believes economic activity is accelerating somewhat, and he was quick to point out that his first inclination is to be very cautious about extending asset purchases after June. But given the emergence of new risks he prefers "a posture of flexibility as regards policy options."

Lockhart doesn't believe that crude priced at $105 will stifle the recovery.  And I believe he is correct, as the 30 cent jump in gasoline prices over the past couple of week, though a psychological blow, seems unlikely to threaten the recovery.

The cost to consumers would run about $30 billion over a year, but that's a drop in the bucket when compared to a $14 trillion economy. Moreover, if consumers believe the spike is temporary, macroeconomic theory implies they'll dig into savings to fund discretionary purchases.  

Lockhart, however, becomes less certain if crude jumps past $150 per barrel, which in his view, could force the Fed to implement another round of bond purchases.

Still, unlike the broad increase we saw in energy prices during the last decade, outside of oil, prices have been well behaved, especially natural gas, which has been holding at relatively low levels.  

Lockhart not overly worried about inflation
Currently, Lockhart does not view inflation as much of a threat.  He believes core inflation has bottomed and is drifting higher, and recognizes the importance of keeping the inflation genie locked up in the bottle.

But he noted that business contacts, who were unable to boost prices last year, are planning to pass along some of their higher costs this year.  That's no big surprise given the latest anecdotal evidence seen in the Beige Book.

Still, he feels demand is too fragile to absorb anything other than small price hikes. And measures of longer-term inflation expectations seem to bear this out.   

Treasury Inflation-Protected Securities (TIPS) market show that longer-term inflation expectations are holding steady, while the yield on the ten-year Treasury bond has been in the neighborhood of 3.50%.  

If investors were worried that a wave of prices increases was set to rock the economy, you'd see much higher yields.

Surging oil prices
If crude were to rocket higher in response to escalating Middle Eastern violence, I see two potential scenarios.  Sharply higher gasoline prices brought on by a supply shock that's analogous to what happened in the 1970s could unanchor inflation expectations.  Throw in a round of money printing and bond buys, and the Fed could easily sow the seeds of a new round of crippling inflation. 

Also possible, surging gasoline prices could crimp demand and stifle economic activity, which the Fed would try to offset by QE3.

QE2 has helped to ignite the latest round of commodity inflation as a quick view of the ThomsonReuters/Jefferies CRB Index reveals. 

But QE2 has not been without benefits, as stocks have also been the recipient on new Fed money, which is bolstering the economic outlook. 

Still, the marginal benefits of new buys is likely to decrease, potentially putting the Fed in a position where further stimulus does little to aid economic activity.

Friday, March 4, 2011

A view of the labor market from a different perspective

Nonfarm payrolls grew by 192,000 in February, which included a rise of 222,000 in private-sector payrolls.  The household survey, which gives us the unemployment rate, showed that employers added 250,000 net new jobs last month, while Wednesday’s release of the ADP employment report revealed the private sector generated a net gain of 217,000 jobs.

That’s the first time in quite a while that all the surveys lined up, indicating that the improving economic climate is finally starting to generate a reasonable level of new jobs.

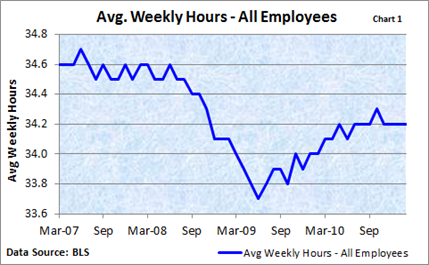
Often buried in the government’s release are two pieces of data that view the labor market from a different angle.  First, let’s look at average weekly hours (chart 1).

image

Interestingly, the number of hours worked each week has held steady at 34.2 hours over seven of the last eight months.  At the beginning of an expansion, most firms are reluctant to hire and encourage current employees to take on added work loads.

But the interruption in the upward trend suggests that employers are beginning to plug some of their open slots from the ranks of the unemployed. It seems less likely that the lack of upward momentum in average hours works is tied to lackluster economic growth given the recent spate of data showing an acceleration in activity.

image

Average hourly earnings, however, has languished during the recovery (chart 2).

On the one hand, unit labor costs are well under control, and the lack of traction in wages is helping to offset the stiff headwinds caused by rising commodity prices.

In other words, we are unlikely to see a spike in core inflation since labor costs are well under control since the supply of workers available is more than adequate in most industries.

However, the lack of any meaningful increases in wages is very likely dampening the nascent rise in consumer spending.

So while it helps to keep inflation under wraps, it also has the potential to limit gains in the economy.

Nonfarm payrolls are reacting to growing economy

Still a long road ahead

Nonfarm payrolls increased by 192,000 last month, including a relatively healthy 222,000 in the private sector, suggesting that the acceleration in economic activity is finally beginning to spur a spate of new jobs. A more formal look at the report is available in my analysis at Examiner.

Before we start popping the corks on the champagne bottles, it’s important to point out that employment is finally back to where it was when the recession officially ended. So let's not obscure the fact that the road to recovery will be a long one.

image

Moreover, taking a look at the strong economic recoveries that followed the steep recessions of 1974 and 1982, job growth has lagged in the wake of the current recession amid the uneven and fragile recovery that ensued following the end of the current slump.

image

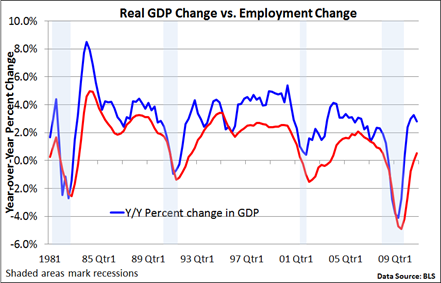
But economic activity and job growth are closely correlated (see chart below) and the recent spurt in economic activity is generating employment per various surveys, and further gains in economic activity are likely to translate into an acceleration hiring as anxiety over the durability of the expansion eases.

image

Of course, this outlook assumes there are not unforeseen shocks that would stifle the expansion.  As I’ve already detailed, $100 per barrel oil will not cause the economy to stall. One reason: the price of natural gas and coal, major forms of energy that heat homes and generate electricity, has been well behaved.

Finally, a quick look at the government’s nonfarm payroll data since the recession began is also encouraging. Private sector payroll growth has been slow to catch fire, but with the exception we saw in January, the direction has been encouraging.

image

According to the Labor Department, payroll employment has increased by 1.3 million from its low point last February, or an average of 106,000 per month.

Over the same period, private-sector employment rose by 1.5 million, or an average of 127,000 per month.
 
Modest, yes, but not enough to significantly take a bite out of the unemployment rate since economists generally agree that 150,000 new jobs are needed each month in order to handle new entrants into the labor force.

That’s why the puzzling decline of 2.4 million in the labor force over the last two years – likely related to discouraged workers – has played a big role in the falling unemployment rate.

Thursday, March 3, 2011

Nonfarm payrolls lag but other measures of employment suggest labor market is healing

The recovery is finally kicking into high gear, as evidenced by much of the economic data out recently – see the latest ISM surveys and falling jobless claims, which I’ll discuss shortly. But the government’s monthly release of nonfarm payrolls has been agonizingly slow to detect that the labor market is benefiting from the improvement in economic activity.

So with the government’s labor report out tomorrow, I wanted to take some time to review what other measures of the job market have been detecting, and much of it has been positive.

As the first chart below reveals, we did see a spike in hiring earlier last year, but that was tied to the temporary jobs generated by the 2010 census, which was then followed by four months job losses as those positions came to an end.

image

Further, the last three months have been disappointing, despite the drop in the unemployment rate, which is derived from the household survey of families, as opposed to nonfarm payrolls, which comes from the establishment survey of companies.

Private-sector growth, however, has been more consistent but not enough to instill confidence in most job seekers.

Fewer are joining the ranks of the unemployed

Weekly jobless claims is released each week and is one of my favorite economic indicators because of its timeliness and how accurately it measures business confidence.

Falling claims tells us that fewer individuals are entering the ranks of the unemployed, but it does not necessarily suggest that firms are ratcheting up on hiring.

image

What it does say is that business confidence is improving, as companies choose to hang onto their employees amid an improvement in the business climate.  And an improving business climate is a key part of the hiring equation.

ADP is detecting movement

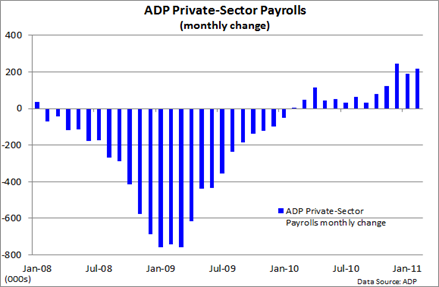
Moving along, the ADP survey of the private sector, unlike the nonfarm payroll survey, has been detecting job growth.

As evidenced by the chart below, job growth has improved in the private sector in four of the last five months in response to faster economic activity.

image

Nonetheless, most analysts, economists, investors and politicians want to see a confirmation from government data that a renewed vigor in hiring is at hand.

Meanwhile, the Fed Chief Ben Bernanke said in his semiannual Monetary Policy Report to the Congress on Wednesday that “we do see some grounds for optimism about the job market over the next few quarters,” including as “improvement in firms' hiring plans.”

The ISM is seeing growth

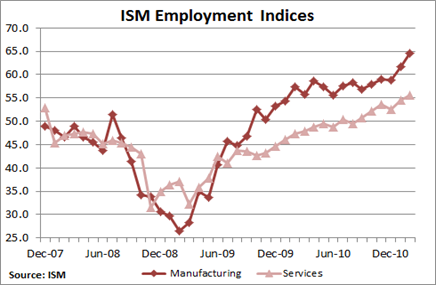
A look at the sub-components of the ISM manufacturing and service surveys does reveal that companies are in the process of ramping up hiring.

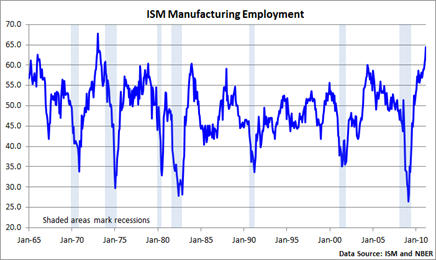
In fact, hiring among manufacturers is now at the highest levels since the early 1970s (see last chart) , while service industries, which make up most of the activity in the U.S. economy, have also been showing signs of life in recent months (see chart below). A reading above 50 suggests companies are adding employees.

image

In a sign that the production side of the U.S. economy is firing on all cylinders, the final chart below, which looks at data going back to 1965, provides indisputable evidence, in my view, that U.S. manufacturers are experiencing hefty increases in demand and are responding with plenty of '”help wanted signs.”

image

Still, the economy is dominated by the service side so it is encouraging to see the ISM services survey detect a renewed interest in bringing folks aboard.

Looking ahead, tomorrow’s release of nonfarm payrolls is expected to show that the economy generated about 180,000 new jobs. Anything just short of 200,000 would be encouraging, however, it's important to point out that forecasters have been too optimistic in recent months. To be fair, the monthly number is very difficult to pinpoint.

Still, based on the evidence that economic activity is accelerating, the recovery is broadening and surveys of the labor market are pointing in the right direction, it’s only a matter of time before the nonfarm payroll survey reflects what’s going on in the economy in my view.

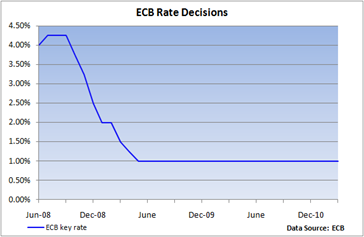
ECB holds rates steady but hints at near-term increase

The European Central Bank (ECB) kept its key interest rate unchanged at 1.0% but hinted that an increase in rates at the next meeting might be forthcoming.

image
In his press conference, ECB President Jean-Claude Trichet said the current stance in monetary policy is "very accommodative" and has been lending considerable support to economic activity.

But he warned, "Strong vigilance is warranted with a view to containing upside risks to price stability."

Trichet would not commit to higher interest rates at the April meeting, which is not a surprise, but he did say such a move is possible, as he appears to be laying the groundwork for a shift in monetary policy.

Unlike the Fed, which has a dual mandate of maintaining the highest level of employment that is consistent with price stability, the ECB's primary objective is price stability, with a goal of keeping the headline CPI “below, but close to, 2% over the medium term.”

The Fed, unlike the ECB, focuses mainly on core inflation, which excludes food and energy, but like the Fed, it doesn’t want to rock financial markets with surprise rate hikes and does telegraph its intentions before acting.

According to the latest data, inflation in February rose to 2.4%, according to Eurostat’s flash estimate, up from 2.3% in January.

image(Source: ECB/Eurostat)


Despite its main aim of keeping inflation under wraps, the ECB does not operate in a vacuum and is aware of the problems that southern Europe is facing.  But it is a much more hawkish group than the Federal Reserve and appears ready to act to prevent rising prices from getting entrenched in the eurozone.  Expect a new round of criticism it the central bank bumps up rates, especially given the problems in parts of Europe.

Not surprisingly, the euro is reacting favorably versus the dollar.

ISM services confirming recovery kicking into high gear

The ISM survey of the service sector, which takes the temperature of the broad-based service sector, shows that economic activity in the economy continues to heat up.

The Institute for Supply Management reported this morning that the ISM Non-Manufacturing Index increased from 59.4 in January to 54.9 in February, the 15th straight month of growth and the sixth straight month that the measure of activity in the service sector accelerated.

A reading of 50 is an indication that the service sector is neither expanding nor contracting.

image

Adding to the positive tone of today’s report, the Business Activity component of the index increased 2.3 points to 66.9, the best reading in seven years, while new orders, a proxy for future activity, fell 0.5 points to 64.4 but the robust level is still suggesting strong gains in the economy.

In the meantime, employment continued in its upward trend, rising 1.1 points to 55.6, the highest level in five years.

Nonfarm payroll growth has lagged, according to the monthly report issued by the government, but weekly jobless claims are falling and ADP’s survey continues to suggest the job market is slowly improving.

Pricing concerns
With growth picking up and input costs rising, the prices paid component inched up from 72.1 to an uncomfortable 73.3, hinting that firms are starting to feel some pressure from higher input costs.

The Fed acknowledged yesterday in its Beige Book that companies are beginning to pass along higher raw material costs, but the largest expense for most businesses – wages – has been holding steady.

Don’t expect the Fed to react to anecdotal reports as it is likely to wait for hard evidence that inflation is rising before taking action.  In addition, core inflation is at 1%, so even a gradual increase toward its goal of getting inflation closer to 2% is probably not enough to prompt action.

Even then, it will want to see a significant jump in job creation before shifting away from its focus on unemployment and taking aim at prices.

At last growth kicking into high gear
We are not seeing much action on the job front per government data, at least not yet, but the chart below, which looks at the ISM’s reports on manufacturing and services are indicating that the economic recovery has gained a significant amount of traction in recent months.

And today’s report that jobless claims fell to the lowest in almost three years is among the clearest signs yet that the recovery is ramping up.

image

With job creation and economic activity closely tied together, is seems likely that nonfarm payrolls will soon be reflecting the sizable improvement we are seeing in economic growth.

Wednesday, March 2, 2011

Fed’s Beige Book sees signs of pricing power

The Federal Reserve’s Beige Book – a summary of economic activity in each of the Fed’s twelve districts, indicated that the economy continued to expand at a modest pace in January and into early February, but manufacturers in a number of districts reported having “greater ability to pass through higher input costs to customers.”

Retailers in some districts also mentioned they had implemented price increases or were anticipating such action in the next few months.

Core inflation remains very low, as evidenced by the chart provided in yesterday’s Monetary Report to the Congress.
image
However, commodity prices have been in a strong upward trend, and regional and national manufacturing surveys have revealed that firms are being pinched by much higher raw material prices.

Nonetheless, policymakers at the Fed still see plenty of slack in the economy, while wages, the largest expense for most businesses, have moved either sideways or marginally higher.  And yields for long-term Treasuries, which would be reacting if investors were sensing a spike in inflation, have been well-behaved.

As a result, the latest forecasts by the Fed show that core inflation is expected to creep upward but not exceed 2.0% by the year 2013.

image

Much of their optimism is based on the fact that longer-term inflation expectations remain anchored, but I sense their attitudes toward price stability may be too sanguine.

Still-high commodity prices and surging gasoline prices in recent weeks do threaten to undermine some of the confidence that consumers have regarding price stability.

Core inflation has likely bottomed and February’s 0.2% rise in the core rate was the fastest increase in 15 months.  By itself, a 0.2% monthly increase does not mean much, but the best news on inflation is probably behind us.

If we begin to see a modest uptick in core prices (odds, though declining, don’t favor this scenario), Fed Chairman Ben Bernanke would find himself in a very difficult predicament, having to choose between a tighter policy, even as unemployment remains high, or keeping the monetary pedal-to-the-metal in the face of rising prices.

Given current political realities, it seems unlikely the Fed would turn its guns on inflation.

Tuesday, March 1, 2011

ISM Manufacturing Index at best reading in nearly 7 years

As the recovery picks up steam, manufacturing remains the leader and continues to fuel economic growth according to the latest survey by the Institute for Supply Management.

The closely-followed ISM Manufacturing Index increased from 60.8 in January to 61.4 in February, its highest reading since May 2004 and the seventh consecutive month that activity has accelerated.  A level above 50 suggests manufacturing in the U.S. is expanding.

image

New orders and production remain at very strong levels (68.0 and 66.3, respectively).

With orders rising and survey respondents continuing to report that customer inventories are too low (falling 5.5 points to 40.0), the outlook in the manufacturing sector is likely to remain very upbeat.

Meanwhile, hiring improved from already robust levels, as the employment index increased by 2.8 points to 64.5, the best reading in almost 40 years according to Bloomberg News.

Inflation building?
About the only cloud on the horizon for goods producers is the high cost of raw materials, as the prices paid component held above 80..  Since commodity prices remain high and demand continues to rise, don’t expect any relief on the pricing front anytime soon.

But there is still plenty of slack in the economy, which limits pricing power (unlike regional survey, the ISM index does not measure prices received), and capacity utilization remains well below levels that would suggest inflation might become an immediate problem.

Moreover, the ThomReuters/Jefferies CRB Index, which is an index that measures the price of 19 commodities, is well off the bottom reached in early 2009 but remains well below the peak hit in July 2008.

image
(Source: Bloomberg)

Still, if demand remains strong, producers will eventually gain the upper hand and start to pass along higher costs, and retail prices could become an issue that the Fed will have to deal with.